Monitoring the first Host
After completing the previous steps your system is now ready for it's first real monitoring tasks.
Study our Monitoring Principles and the Deploy Monitoring Configuration process to get a better understanding of the main concepts of Monitoring with i-Vertix.
We provide several ways of creating your monitoring configuration:
- the default, manual way
- a network topology discovery to onboard network devices
- a network scan using nmap and snmp
- vmware discovery to onboard whole vmware datacenters in combination with the further virtual machine OS scan
- meraki discovery to import your cisco meraki ecosystem
- a easy-to-use service discovery to increase the monitoring quality of your monitored servers and devices
To start off, let's create the monitoring configuration for the Central Management server itself by hand.
Manually configure your first host
-
Make sure you have the following plugin pack installed:
i-Vertix4 Monitoring CentraltipThe process of installing plugin packs was part of this previous chapter of the Quick Start Guide or is fully described in the Plugin Packs Guide.
-
Navigate to ConfigurationHosts
-
Click the
Addbutton on top of the list to open the form for creating a new host -
Fill in following information:
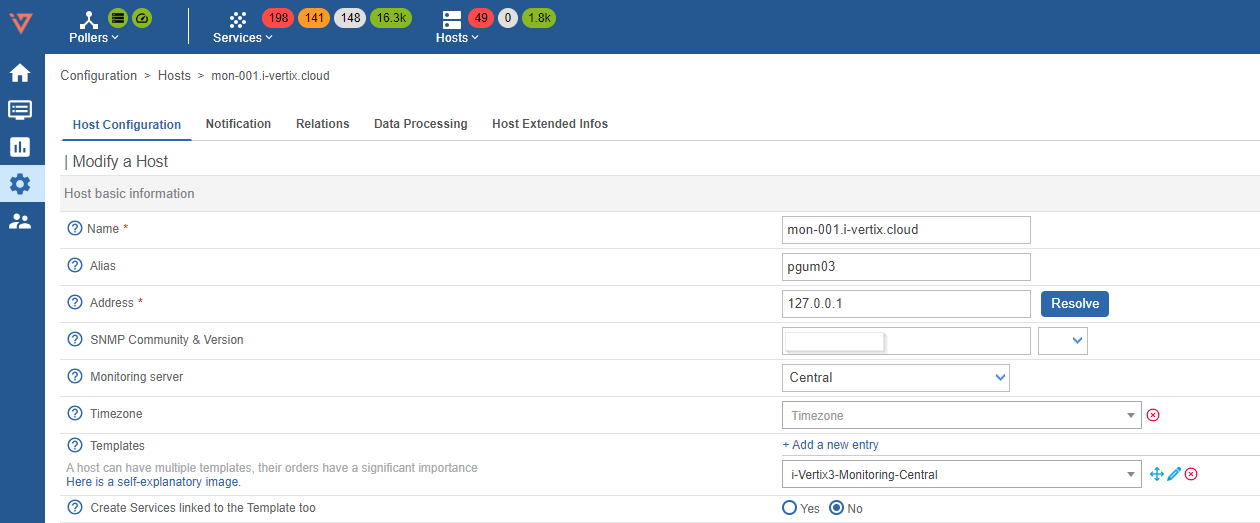
- Name: insert the device name / host name (no spaces allowed)
- Alias: insert an alternative name / readable name
- IP Address / DNS: IP address or FQDN of the host (insert 127.0.0.1 in this case). If you enter a FQDN you can click on
Resolveto check if the system is able to resolve the hostname - Monitored from: select Central from the dropdown menu
- Templates: Click Add a new entry and select
i-Vertix4-Monitoring-Centralfrom the dropdown list - Create Services linked to the Template too: select Yes
-
Click
Saveto add the new host
The monitoring configuration for the Central Management server is now created. Most of the configuration comes from the assigned Host Template: snmp community & version, the default readonly credentials for the database and default ports. In combination with the applied Create Services linked to the Template too the most relevant monitoring services are automatically created, such as: CPU, important storages, inodes, RAM, ntp, swap, load, uptime, important processes providing the monitoring service and the database.
This example shows the true power of Plugin Packs and the monitoring templates they bring along.
To finish off this example, let's discover the server's interfaces and monitor them as well.
-
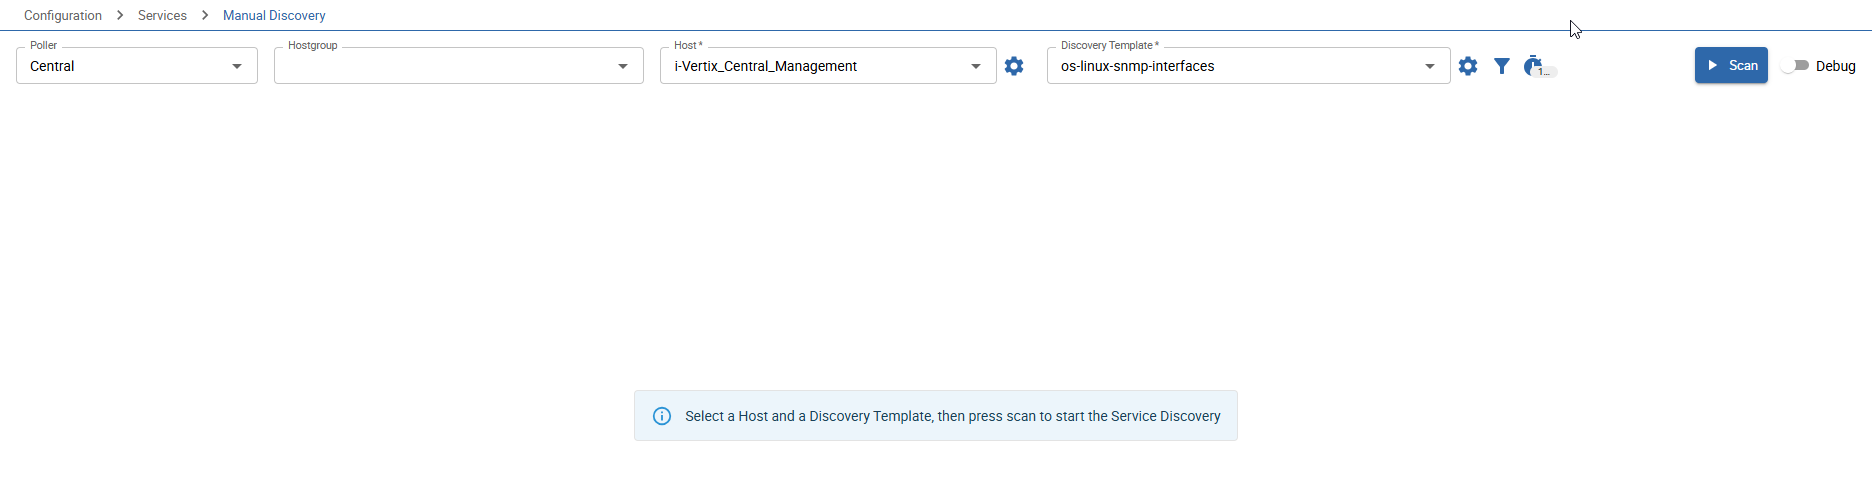
Navigate to ConfigurationServicesManual Discovery
-
Select the Host you have created just now
-
Select the
os-linux-snmp-interfacesDiscovery Template and hitScan -
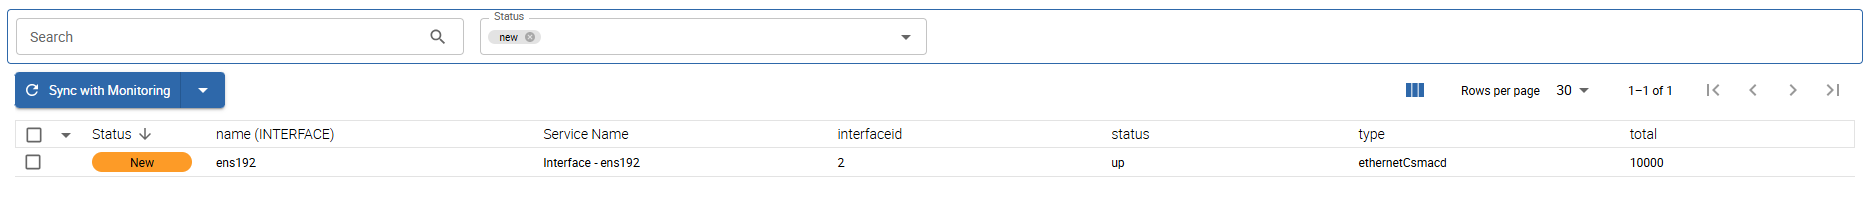
Shortly after you should see the discovered interfaces which are configured on the Central Management system
-
Check the boxes of interfaces you want to monitor and click
Sync with Monitoring
Now you have monitored also the interfaces of your fresh Central Management server.
Let's Export the Monitoring Configuration now to start monitoring your first host. Please read this quick guide on how to export the monitoring configuration for a poller