Setup & Configuration
License acquired and ready? Let's install the new i-Vertix IT Monitoring Netflow module on your existing i-Vertix monitoring system!
To understand the main components, which are part of the i-Vertix IT Monitoring Netflow module, please read the netflow infrastructure chapter.
Setup
To provide a fast and easy setup of the new netflow functionality, we prepared production-ready virtual images for the Netflow analyzer with a short guided setup process and a new package for the i-Vertix Poller.
Prepare the Netflow Analyzer
When you pruchase the license for the netflow add-on you receive the latest version of our Netflow analyzer image for VMware. Let us know if you need other virtual image formats.
Here is a guide on how to import a virtual appliance into VMware.
System requirements
It is not easy to determine the required hardware resources for the netflow analyzer system just from the beginning. It may be necessary to tune the resources over time, depending on the count of incoming flows.
Network definitions
| Small Network | Medium Network | Large Network | |
|---|---|---|---|
| Network Traffic | <100 Mbps | 100 Mbps - 1 Gbps | > 1 Gbps |
| Hosts in your Network | 0-1k | 1k - 50k | > 50k |
| Flows* | 0-1k | 350 GB | 500 GB |
*Flows: flows processed at the same time (Live flows)
Resources by Network
| Small Network | Medium Network | Large Network | |
|---|---|---|---|
| CPU | 2 Cores | 4 Cores | 6 Cores |
| RAM | 2 GB | 8 GB | 12 GB |
| Storage* | 150 GB | 350 GB | 500 GB |
*Storage: the required storage is highly dependant on the number of collected flows and the configured retention. It may be necessary to tune the retention or add additional storage to the system in production!
First start of the Netflow analyzer system
After you have imported the netflow analyzer image, start the new virtual machine and use the provided credentials to log in.

In case the menu does not appear, execute the following command to enter the menu:
menu
Before starting with the setup procedure, please configure the system's network settings by choosing option 5) Network settings.
Here is a guide on how to configure the network.
After configuring the network settings, you can proceed with the initial setup.
From the menu, choose option 9) Setup i-Vertix NetFlow services to start the setup script.
Most actions of the setup script are done automatically:
- a random password for the clickhouse database is generated
- start of the clickhouse database server
- initialize basic netflow configuration
Now you are prompted to enter the IP address of the Central Monitoring server. The central monitoring server must be reachable on this system using the entered IP address.
After confirming the entered IP address the setup continues and should finish without problems. In case of any errors, please reach out to our support.
You can now proceed with the monitoring module installation.
Install the monitoring module
Open an SSH connection to your monitoring central system and install the ivertix-netflow-module package:
sudo dnf install ivertix-netflow-module
sudo bash /opt/i-vertix/scripts/netflow/setup.sh
After the install is complete, log into your monitoring system with an administrator account.
Perform the extension installation from the Extension Manager under AdministrationExtensionsManager and install the new Netflow by i-Vertix extension.
Now we need to configure the connection between the monitoring and the Netflow analyzer system.
Navigate to AdministrationAdditional ModulesNetflow Settings to perform the initial module setup.
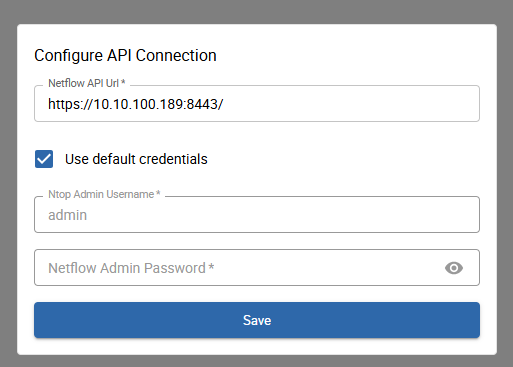
Please insert the IP address of the Netflow Analyzer system, as seen by the monitoring central system into the form.
Below you can choose to use the default credentials or insert custom ones for the admin account. Keep using the default credentials if you are setting up a fresh netflow system.
If you are relocating your netflow system to a new monitoring system you may need to use custom credentials because the admin user is most likely already initialized.
When hitting save, the following tasks will be executed:
- Connection check to Netflow analyzer API
- Login with provided (or default) credentials and check user permissions (admin account required)
- Generate a new secure random password for the provided admin user
- Create a new vault credential and save the connection information to the monitoring configuration db
When you encounter any problems during the connectivity check or password reset, please check the provided error message for further information.
Most likely the monitoring system is not able to connect to the Netflow analyzer system due to firewall or network problems. Also make sure that the Netflow analyzer system is properly set up!
After the connection information is successfully saved we can now set up and configure our first NetFlow collector.
Add NetFlow collectors
As already stated in the introduction, NetFlow collectors receive the flows from network devices and send them to the central NetFlow analyzer system.
You can easily upgrade any existing i-Vertix Poller that is already connected to your monitoring system to become also a Netflow collector.
Please keep in mind that upgrading your poller to a Poller + Netflow collector increases the hardware consumption. If your poller, which you want to upgrade, is already scratching the limit of it's available hardware resources you need to add further hardware resources.
You can also add a new dedicated poller which only functions as a NetFlow collector. Please follow these steps to attach a new poller to the monitoring system.
After you have added a new poller or made sure enough hardware resources are available on your existing poller we can proceed with the installation of the netflow collector packages.
Install required packages
Please open a SSH connection to the desired poller and install the ivertix-netflow-poller package from the ivertix netflow repository:
sudo dnf install ivertix-netflow-poller
To install the package ivertix-netflow-poller you first need to add the ivertix netflow repository.
You receive a dedicated guide to install the repository upon obtaining the license for the add-on.
After the package is installed, you can configure the collector from the monitoring interface.
Configure the new NetFlow collector
To configure new NetFlow collectors, navigate to ConfigurationNetFlowExporters in the monitoring interface.
Only administrators can manage NetFlow collectors!
Click the + Add new NetFlow collector button located at the top of the page and insert following information in the opened form:
NetFlow Analyzer settings
These settings are written to the NetFlow analyzer system.
- Poller: choose the i-Vertix Poller, which should operate as the NetFlow collector - the
ivertix-netflow-pollerpackage must be already installed on the poller - NetFlow Collector Name: defaults to the poller name - choose another name if you like
- NetFlow Analyzer Interface Port: interface port to which the collector sends the flows to - must be unique and between 5556 - 5656
NetFlow Collector settings
These settings are deployed to the poller.
- NetFlow Collector Port: this is the port to which the network devices send their flows
- NetFlow Analyzer IP: IP address of the NetFlow Analyzer system as seen by the poller (collector)
- Netflow Analyzer Interface Port: interface port to which the collector sends the flows to - by default the above configured interface port and this one are equal - only change if a firewall or proxy forwards the port
Save the new collector after you have filled all fields. A new netflow API user will be created for the new collector which is used to display the collected flows.
If you encounter any problems during the configuration of the new collector, please check the provided error message for further information. This error can occur if you have custom interfaces configured on the NetFlow Analyzer itself. Simply select an other port number in the available range.Most common problems
Unable to deploy configuration
ivertix-netflow-poller package is installed on the pollerUnable to create new user
Interface port already in use
Configure Network Devices to send flows
Here are useful links to enable network devices of different vendors to send Cisco NetFlows, sFlows or IPFIX flows to configured collectors:
Please note that the following configuration guides are provided for reference only. We do not take any responsibility for potential damage to your network devices or any issues that may arise as a result of applying these configurations. Make sure to back up your device settings before making any changes.
This list is far from complete. If your device or vendor is not listed, it is always a good shot to search the vendor's documentation for up-to-date guides regarding sFlow/NetFlow/IPFIX configuration.
Register Network Devices as Flow Exporters
After you have configured your network devices to send flows to the NetFlow collector, you must register them as NetFlow Exporters in the monitoring interface.
First, make sure the network devices are monitored. If you don't have them configured yet, take a look at our Network Discovery which can help you with the onboarding.
Navigate to ConfigurationNetFlowExporters, select the Exporters tab (only when admin) and click the + Add Exporters button on the top right of the list.
A popup containing a list will appear. Select the NetFlow collector to which you want to add exporters. On the right of the collector select you find the filter input. With it, you can filter all hosts by name, host templates, poller, ip, host group or host category.
Select all hosts you want to add as exporters to your selected collector and hit Confirm.
Upon the new exporters are saved, a new task is started in the background which scans the exporter interfaces.
This is no critical task because the scanned interfaces are only used for display purposes in some flow-views.
You can restart the scan process anytime.
View and edit Exporters
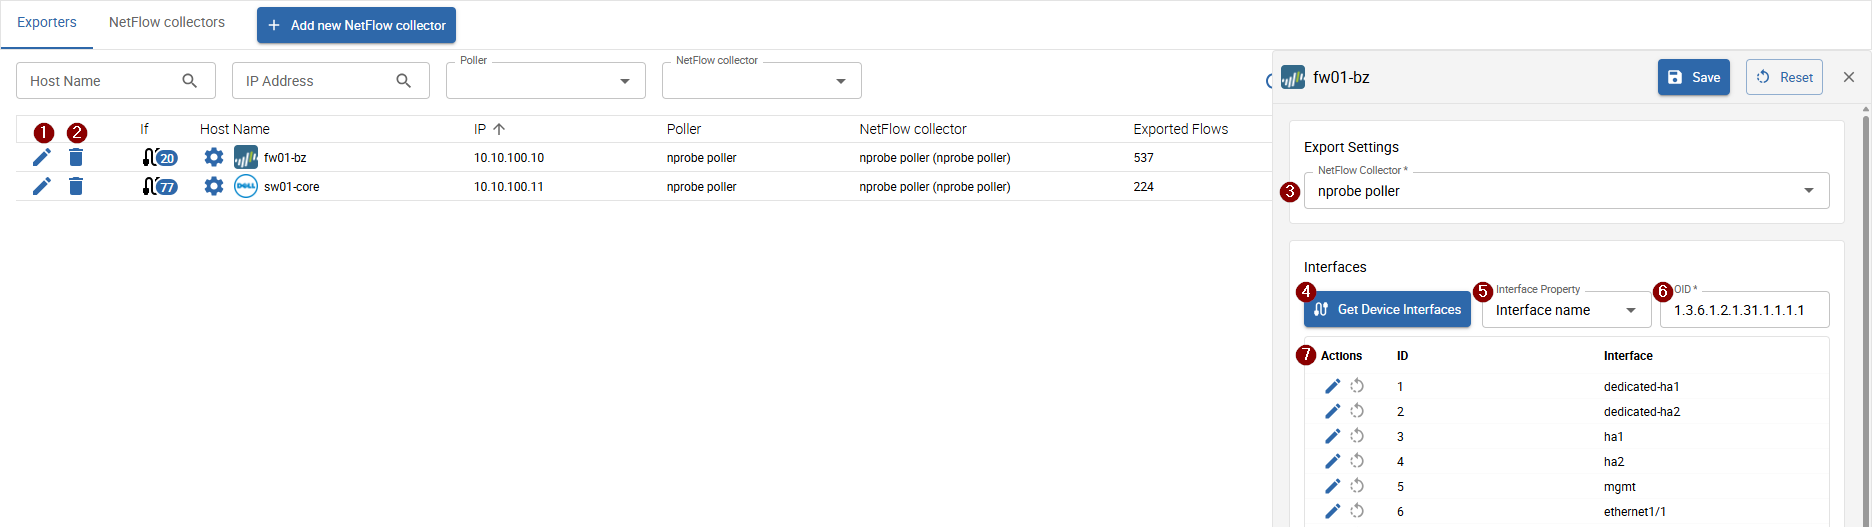
The list shows all accessible configured exporters along with the most important information regarding each exporter, such as the collector, exported flows, dropped flows and last update.
Actions
- click the 1 edit icon to start editing an exporter
- click the 2 delete icon to delete an exporter
Edit an Exporter
You can change the 3 collector to which the exporter sends to (this must also be configured obviously on the network device itself)
as well as customize the scanned interfaces.
To rescan the interfaces click the 4 Get Device Interfaces button.
The provided 6 OID is used for the scan.
You can also select a predefined OID from the 5 Interface Property select or
set a custom name in the below 7 interface list.
After you modified and saved an exporter, make sure to deploy the changes to the poller (collector) using the Deploy changes button above.
Otherwise your changes will not be taken into account.
You should now be ready to start analyzing incoming flows. On the next page you find the documentation to view and alayze Live Flows and Host Stats.
Troubleshooting
No incoming flows
In the exporter list you find the counts of exported and dropped flows of every configured exporter (flow sending network device).
The most common reason to find the counts empty is a wrong network device configuration or a blocking firewall.
Make sure that the flow configuration is correct for your type of network device. Check the official vendor docs for configuring sFlow/NetFlow/IPFIX to find a helpful guide.
Also check your firewall policy for:
- the defined collector port (default: 6363, Network device -> NetFlow collector)
- the defined NetFlow Analyzer interface port (NetFlow collector -> NetFlow analyzer)
Unable to connect to netflow API
- Check your firewall policies for the NetFlow Analyzer system - TCP port 8443.
- Make sure that the NetFlow Analyzer system is initialized and the
ntopngandclickhouse-serverservice is running. - Verify that you have a valid netflow license