Monitoring Central and Poller
Monitoring Central
In this example we show how to manually add and monitor the Central Manager from itself.
If you already have installed the i-Vertix Monitoring Central plugin pack you can skip step 1 and 2
Head over to Administration -> i-Vertix -> Plugin Store using the left side-menu
Search and install the plugin pack i-Vertix3 Monitoring Central
After the successful installation of the plugin pack you can head over to Configuration -> Hosts -> Hosts
To add a new host click the blue button Add which is located between the top-side filters and the bottom list
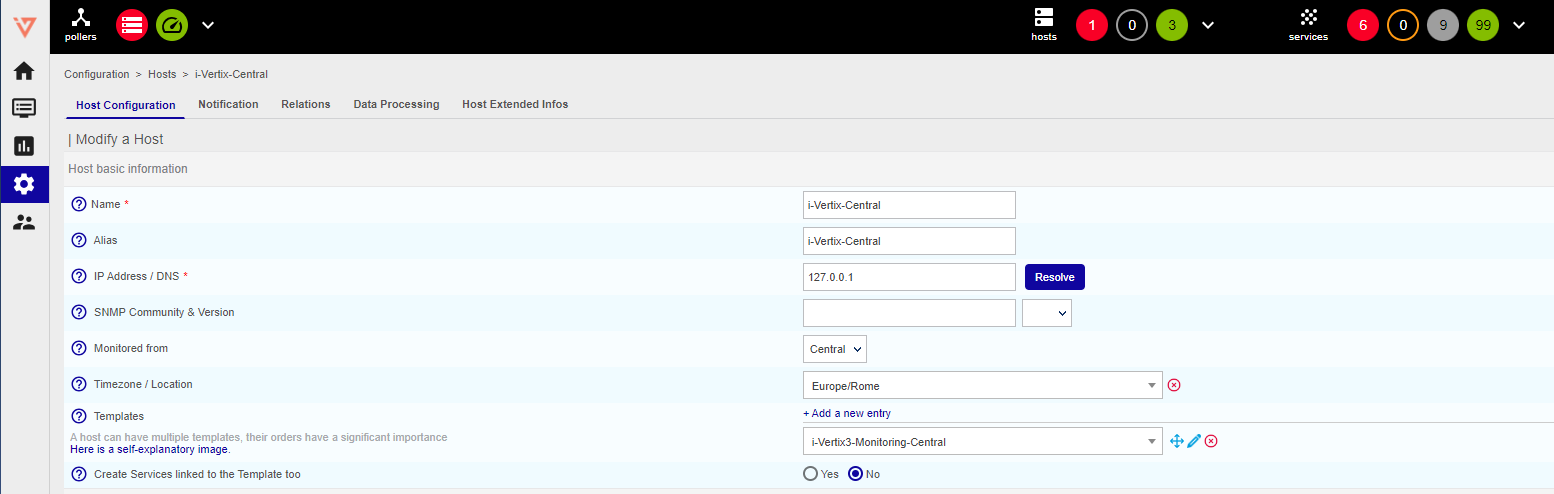
- Fill in the following fields:
- Name: insert the device name / host name (no spaces allowed)
- Alias: insert an alternative name / readable name (spaces allowed)
- IP Address / DNS: IP address or FQDN of the host (insert 127.0.0.1 for the Central Manager). If you enter a FQDN you can click on Resolve to have the system check name resolution.
- Monitored from: Select Central from the dropdown menu
- Templates: Click Add a new entry and select i-Vertix3-Monitoring-Central from the dropdown list
- Create Services linked to the Template too: Select Yes
- Click on Save
Monitoring Poller
In this example we show how to manually add and monitor the Smart Poller from itself.
If you already have installed the i-Vertix Monitoring Central plugin pack you can skip step 1 and 2
- Head over to Administration -> i-Vertix -> Plugin Store using the left side-menu
- Search and install the plugin pack
i-Vertix3 Poller VM
After the successful installation of the plugin pack you can head over to Configuration -> Hosts -> Hosts
To add a new host click the blue button Add which is located between the top-side filters and the bottom list
Fill in the following fields:
- Name: insert the device name / host name (no spaces allowed)
- Alias: insert an alternative name / readable name (spaces allowed)
- IP Address / DNS: IP address or FQDN of the host (insert 127.0.0.1 for the Central Manager). If you enter a FQDN you can click on Resolve to have the system check name resolution.
- Monitored from: Select Central from the dropdown menu
- Templates: Click Add a new entry and select i-Vertix3-Monitoring-Central from the dropdown list
- Create Services linked to the Template too: Select Yes
Click on Save
Monitoring additional services (Service Discovery)
Once you have added a host you can discover additional services
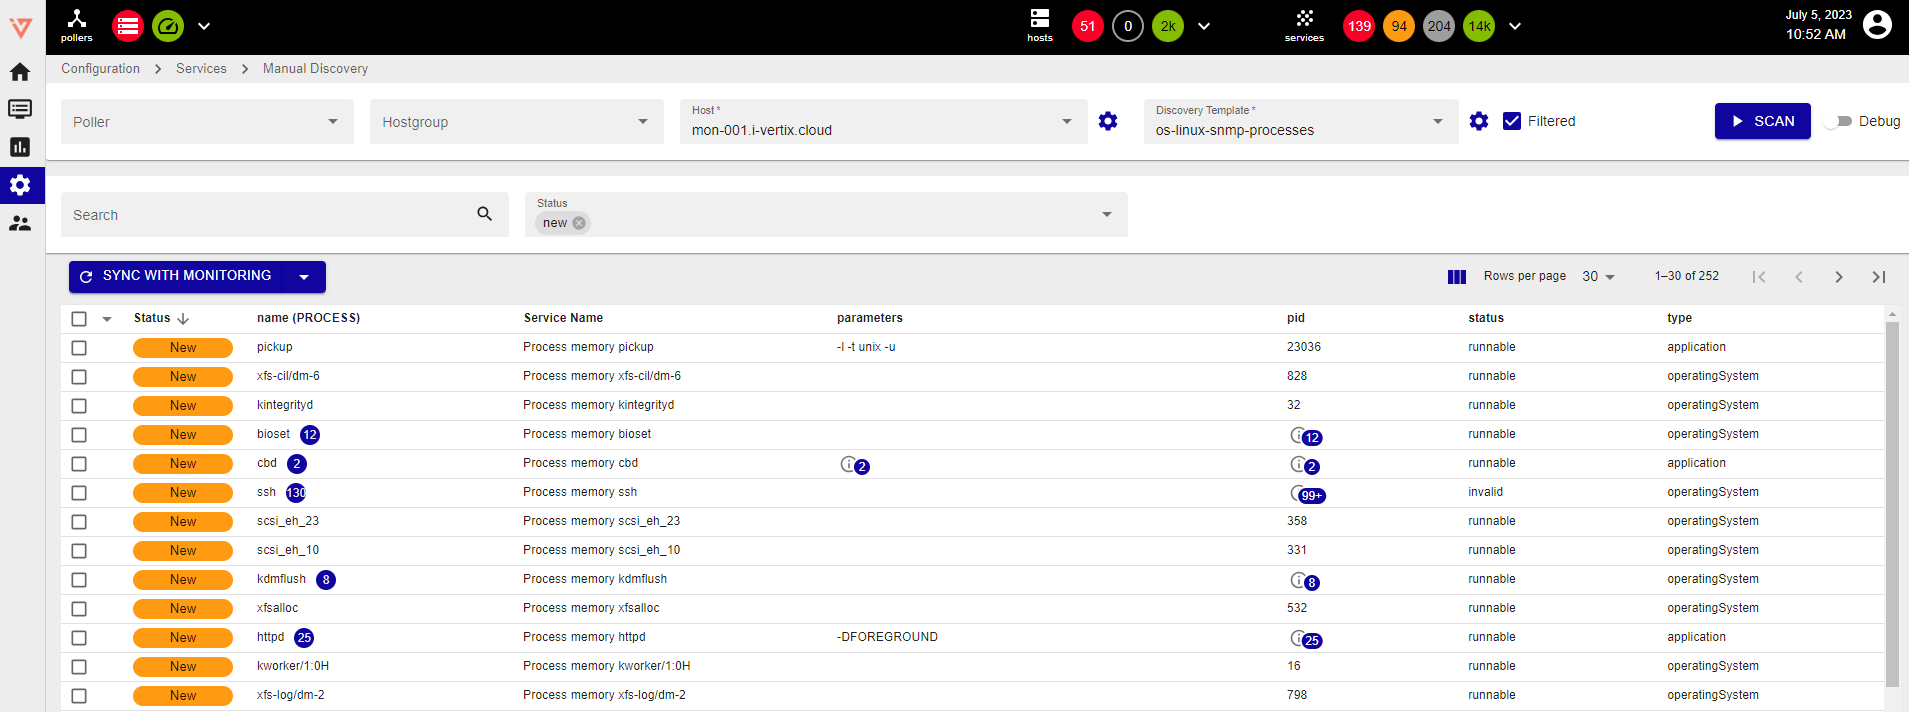
- Head over to Configuration -> Services -> Manual Discovery using the left side-menu
- Select:
- Poller: This acts as a pre-filter for the host-select
- Host: Select the Host to which you want to add services (for example the i-Vertix-Central)
- Discovery template: set of commands that have to be executed to search for services (the system automatically shows relevant/applicable ones)
- Click on Scan Host
- Select the Services you want to monitor by checking the checkboxes and click on Sync with Monitoring
EXPORTING THE CONFIGURATION
Once the host and services have been added, it is essential to export the configuration for the changes to take effect.
See the post Export the configuration for further explanation.