Graph template
Definition
Graph models are models which can be used to shape graph layouts. Graph models can be used to configure multiple presentation settings including the y-axis measurement, the width and the height of the graph, or colors, etc.
Configuration
Go to the Monitoring > Performances > Templates menu
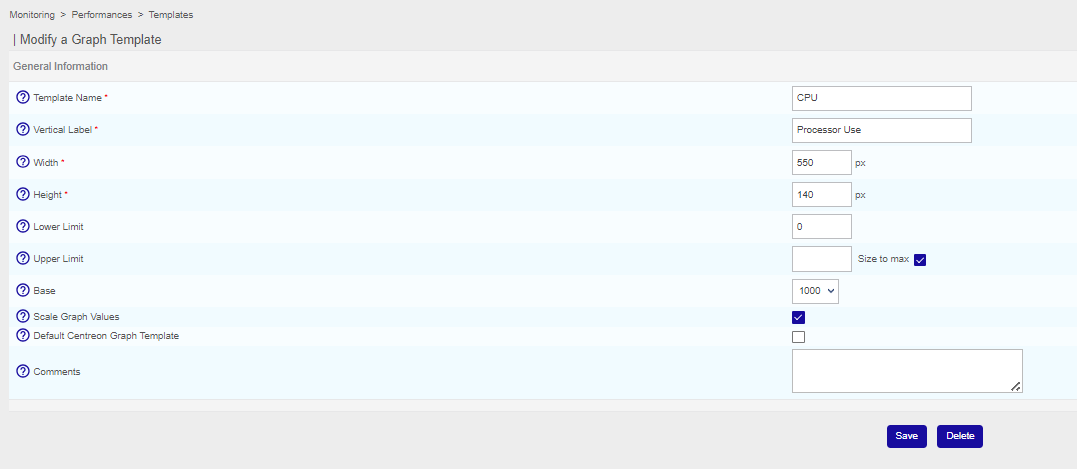
- The Template name field represents the name for the graph model
- The Vertical label field contains the legend for the y-axis (type of data measured).
- The Width and Height fields are expressed in pixels and express respectively the width and the height of the model.
- The Lower limit field defines the minimum limit of the y-axis.
- The Upper limit field defines the maximum limit of the y-axis.
- The Base list defines the calculation base for the data during the scaling of the graph y-axis. Use 1024 for measurements like the Bytes (1 KB = 1 024 Bytes) and 1 000 for measurements like the volt (1 kV = 1 000 Volts).
- The Scale Graph Values checkbox enable auto scale of the graph and bypass previous options
- The Default i-Vertix Graph Template allows to display all chart without predefined template using these values
note
Regardless of the selected value, base 1024 will be used on following metric units:
- B
- bytes
- bytespersecond
- B/s
- B/sec
- o
- octets
info
If the box Size to max is checked, the graph will automatically be scaled to the scale of the maximum value ordinates shown on the given period.
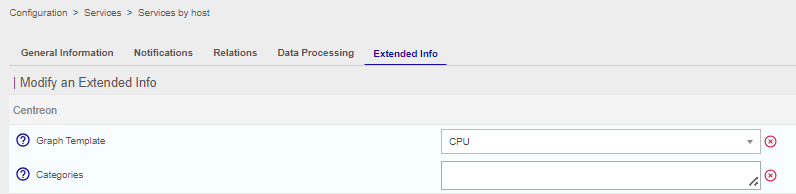
Using a graph template
You can add this layout model on edition a service (or a template of service) by going into the Service Extended Info tab in configuration form: