Troubleshooting
While configuring hosts and services on your monitoring system, you may:
- have difficulties setting the correct thresholds for your services
- be unsure how to reach your host
- want to retrieve a full SNMP walk of your devices
- encounter routing or DNS problems
and many other situations that require you to analyze or test configurations or devices.
To assist you, you can use the built-in Monitoring Troubleshooter, available on every page of the monitoring interface.
Troubleshooting Capabilities
Our built-in Monitoring Troubleshooter offers the following features:
- Monitoring Plugins
- SNMP
- Utility Commands
Configure and test services on the fly, without the need to export the configuration each time:
- change service macros as needed
- import values from credentials
- create a new service from your current configuration
- update an existing service (service macros, host macros, and affected host values)
Launch snmpget requests or snmpwalks from any poller.
Execute various utility commands from any poller.
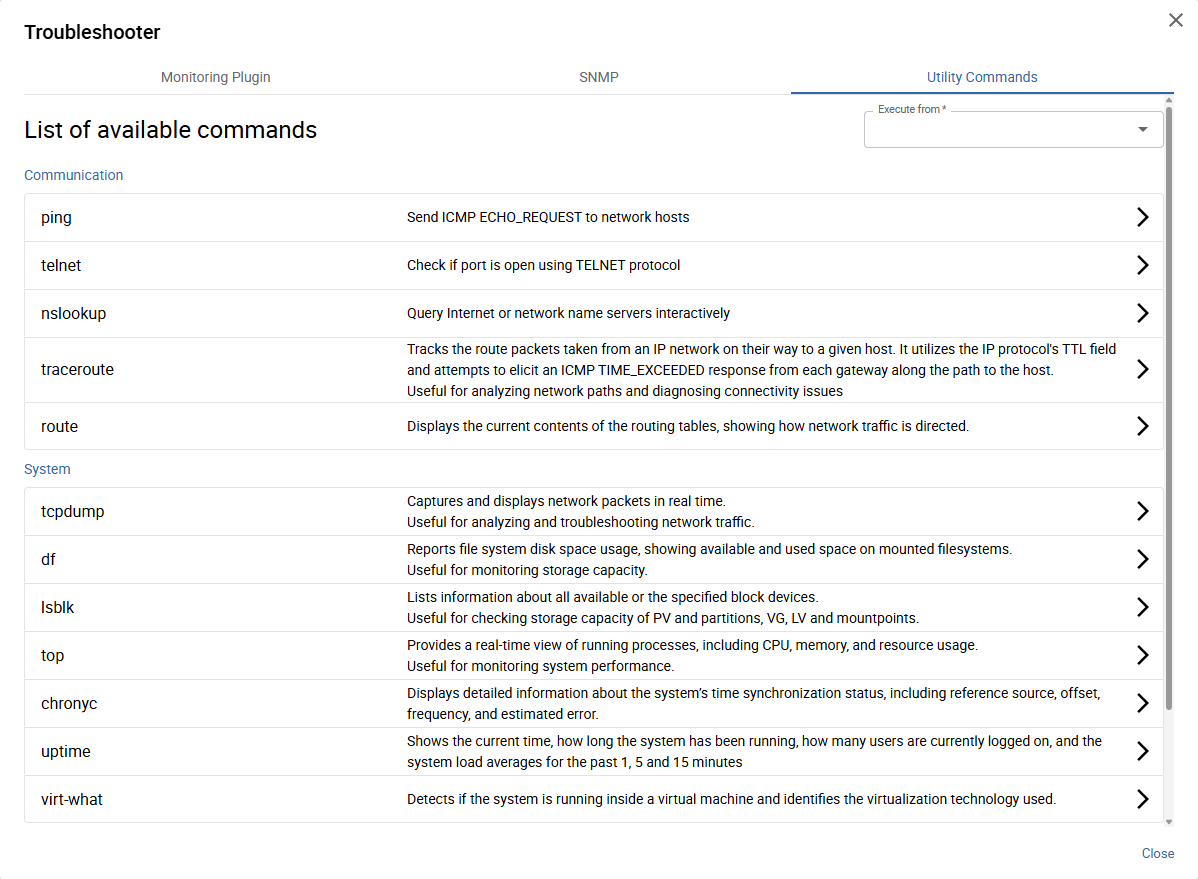
List of available utility commands
Accessing the Monitoring Troubleshooter
There are two ways to open the Monitoring Troubleshooter:
From the Resource Status page
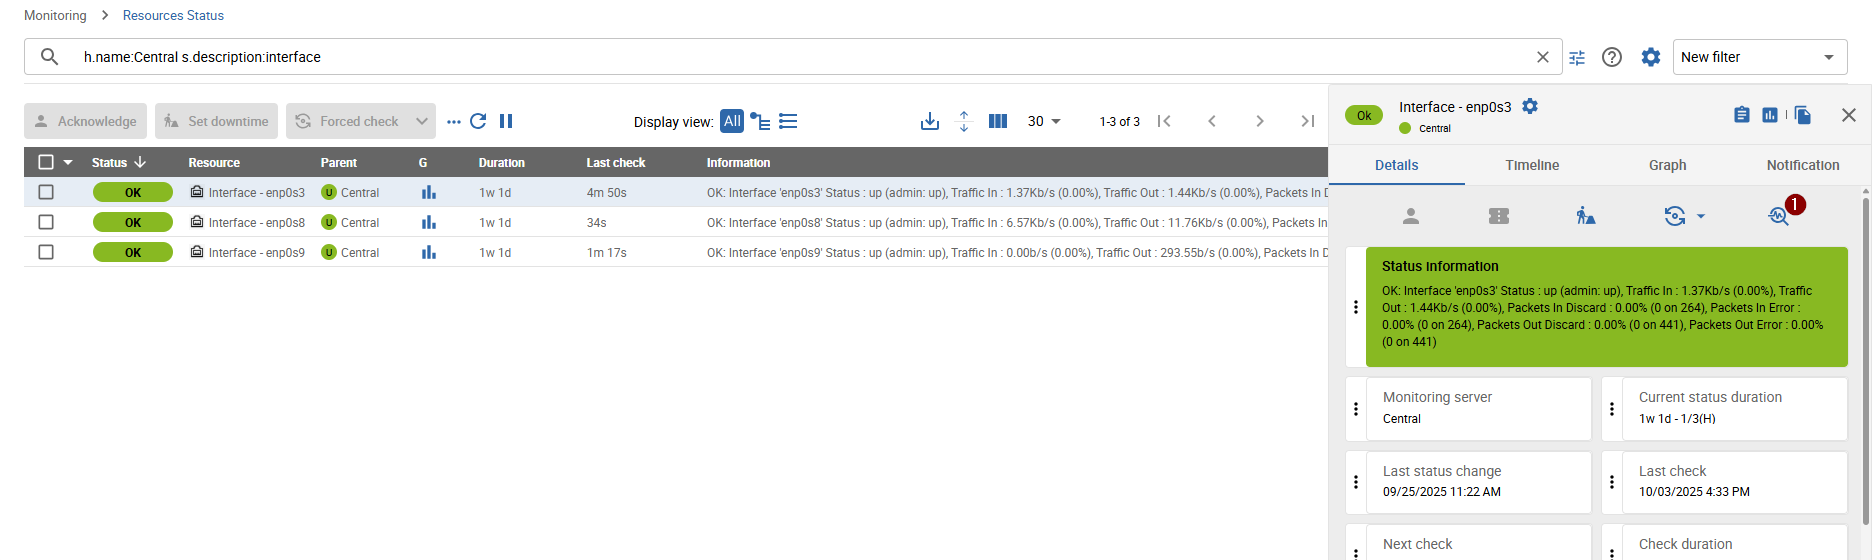
By clicking the 1 Troubleshoot icon, the Troubleshooter popup opens on the Monitoring Plugin
tab with the current host/service resource pre-selected.
From the Sidebar
accessible on every page
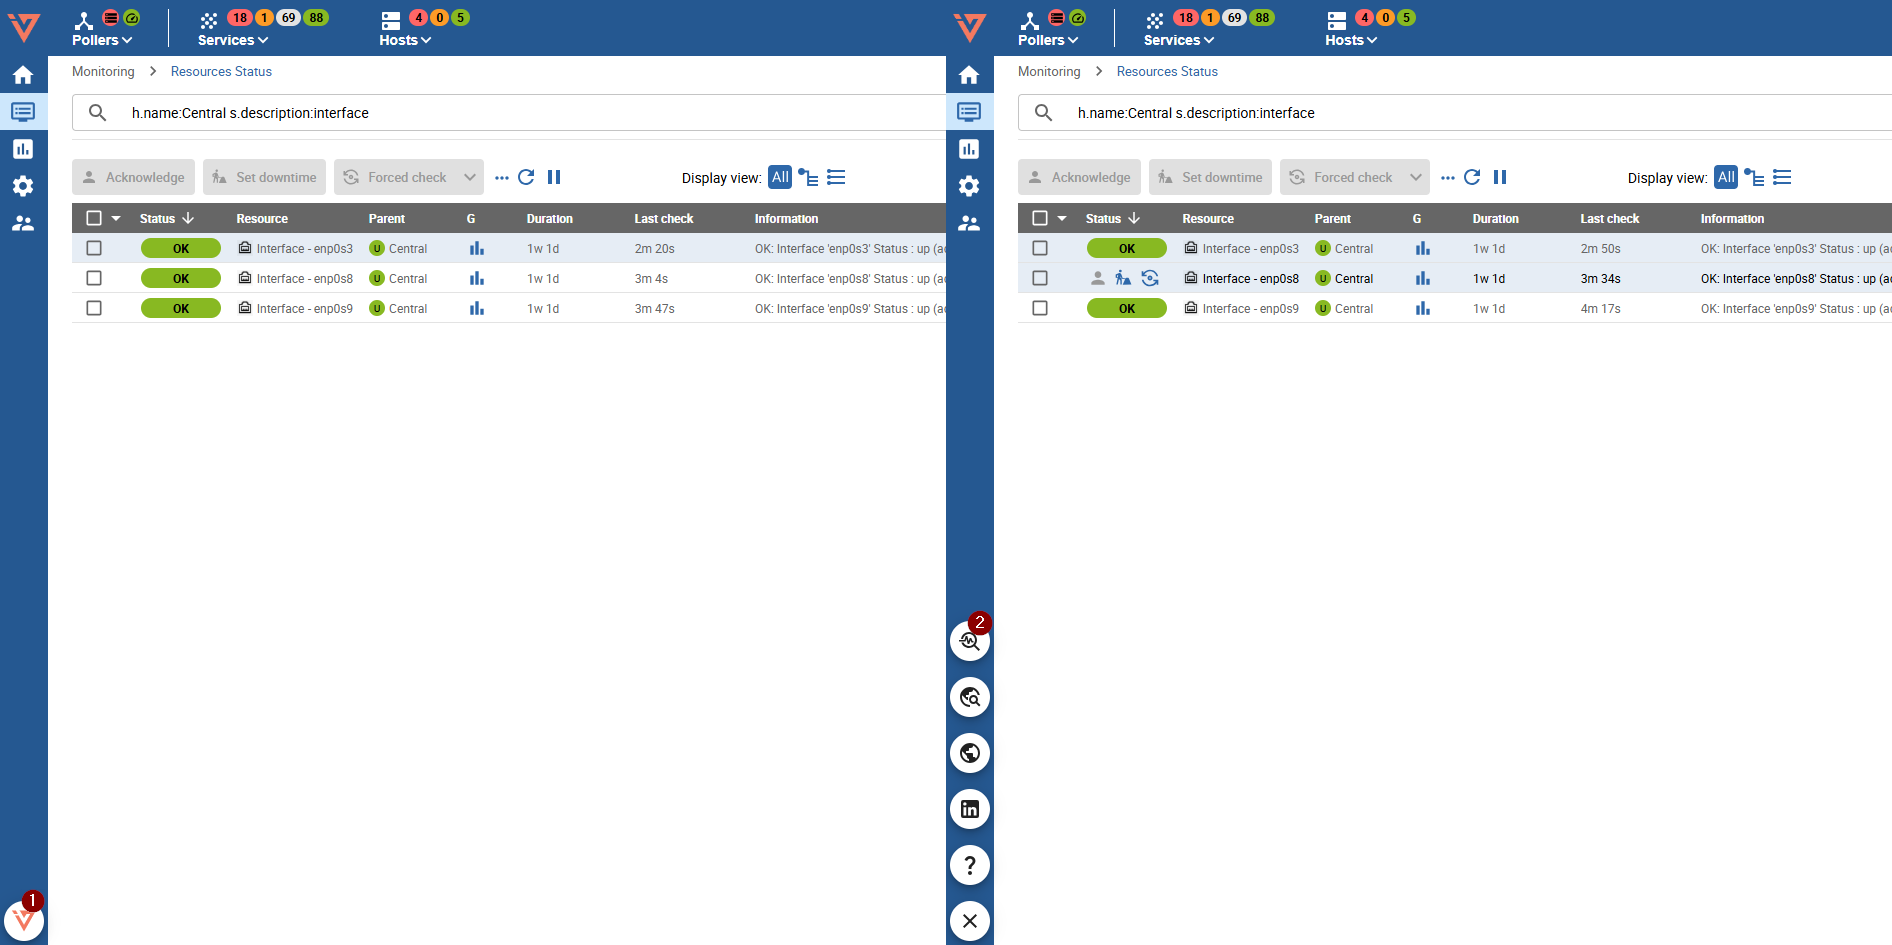
By first clicking the 1 i-Vertix icon and then the 2 Troubleshoot icon,
the Troubleshooter popup opens by default on the Monitoring Plugin tab with the last used host/service resource pre-selected.
Grant Access to Functionalities
The Troubleshooter is enabled by default only for administrators, who have full access to all monitoring features by default. If you want to grant access to specific Troubleshooter functionalities to other users, you must configure the permissions in the Menu ACL.
Navigate to AdministrationACLMenu Access and select the Menu ACL to which you want to grant access.
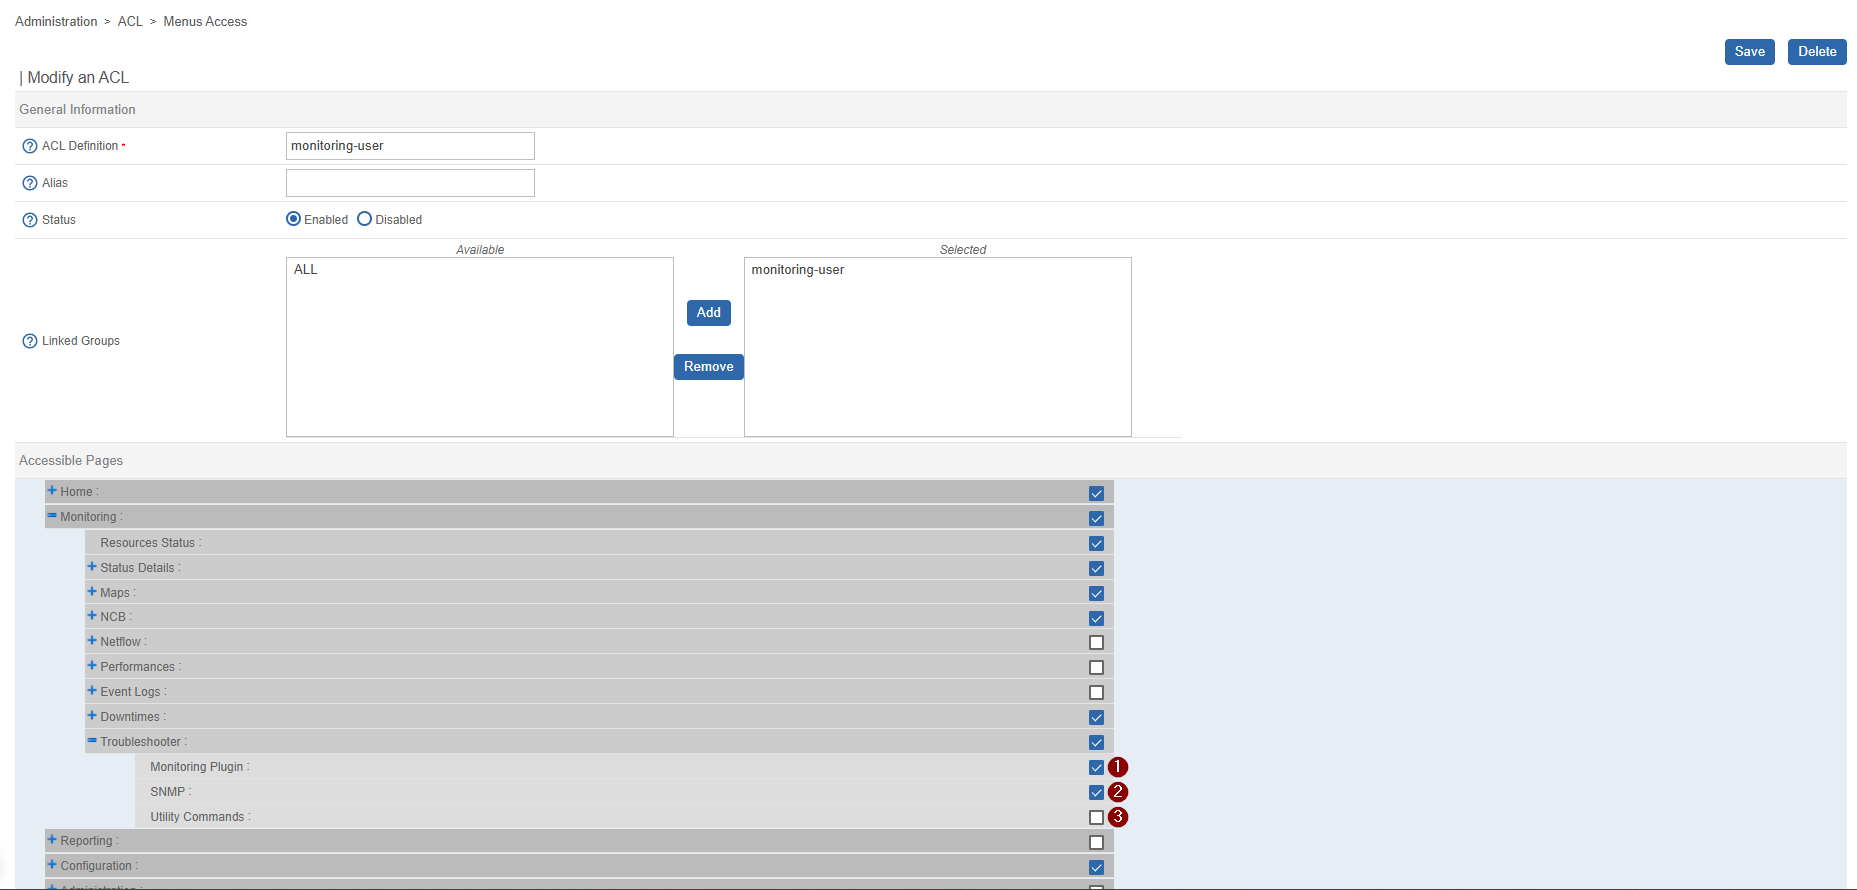
Expand the Monitoring → Troubleshooter section and select the features
(1 Monitoring Plugin, 2 SNMP, 3 Utility Commands)
you want to make accessible.
Click Save once you are done.
After saving, all monitoring users associated with the access groups assigned to the modified Menu ACL will have access to the selected Troubleshooter features.
Troubleshooting Monitoring Plugins
accessible from the Monitoring Plugin tab
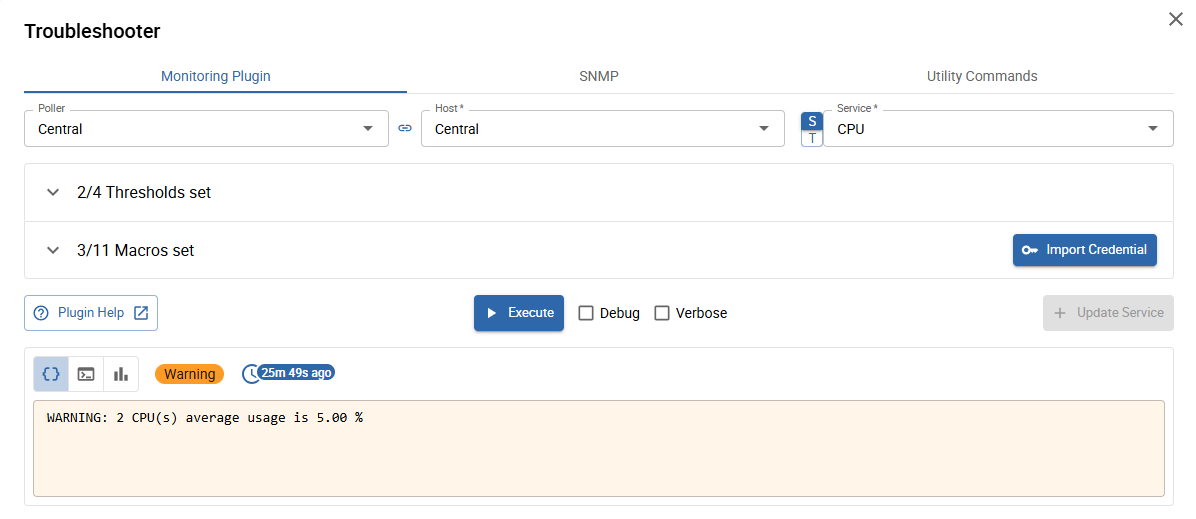
When opening the Monitoring Plugin tab for the first time, you will see the following view:
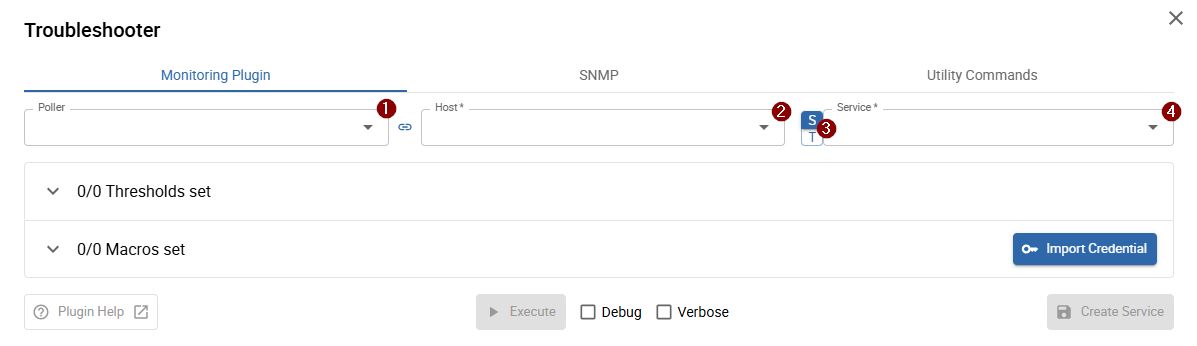
Select a resource
- 1 Poller (optional)
- 2 Host
- 3 Switch between service & service template: switch to
Tto start from a service template, or keep it onSto select an existing service - 4 Service/Service template
All resources are loaded directly from the monitoring configuration — there is no need to export it to use the Troubleshooter.
After selecting a resource, all macros are automatically loaded based on the selected service/service template and host.
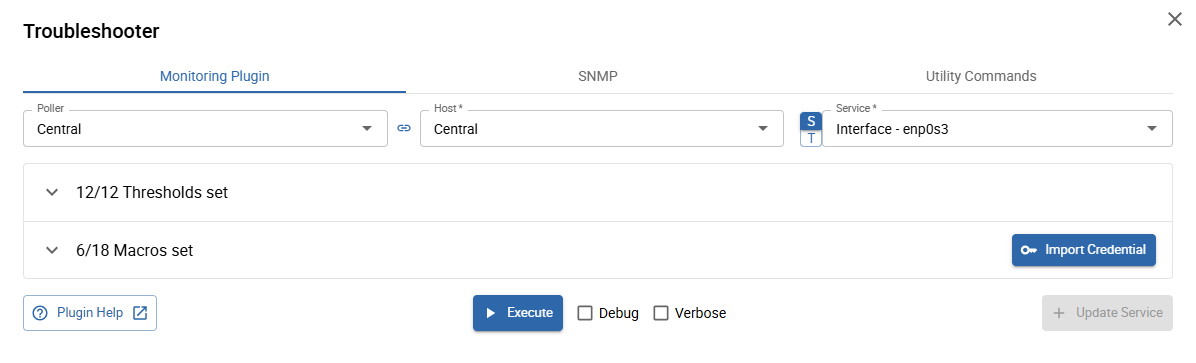
Define or change macros
The "heart" of the Monitoring Plugin Troubleshooter are the Macro sections. In these sections, all (set and unset) service and host macros of the underlying command are displayed and configurable.
Click on one of the two sections (Macros or Thresholds) to expand the list:
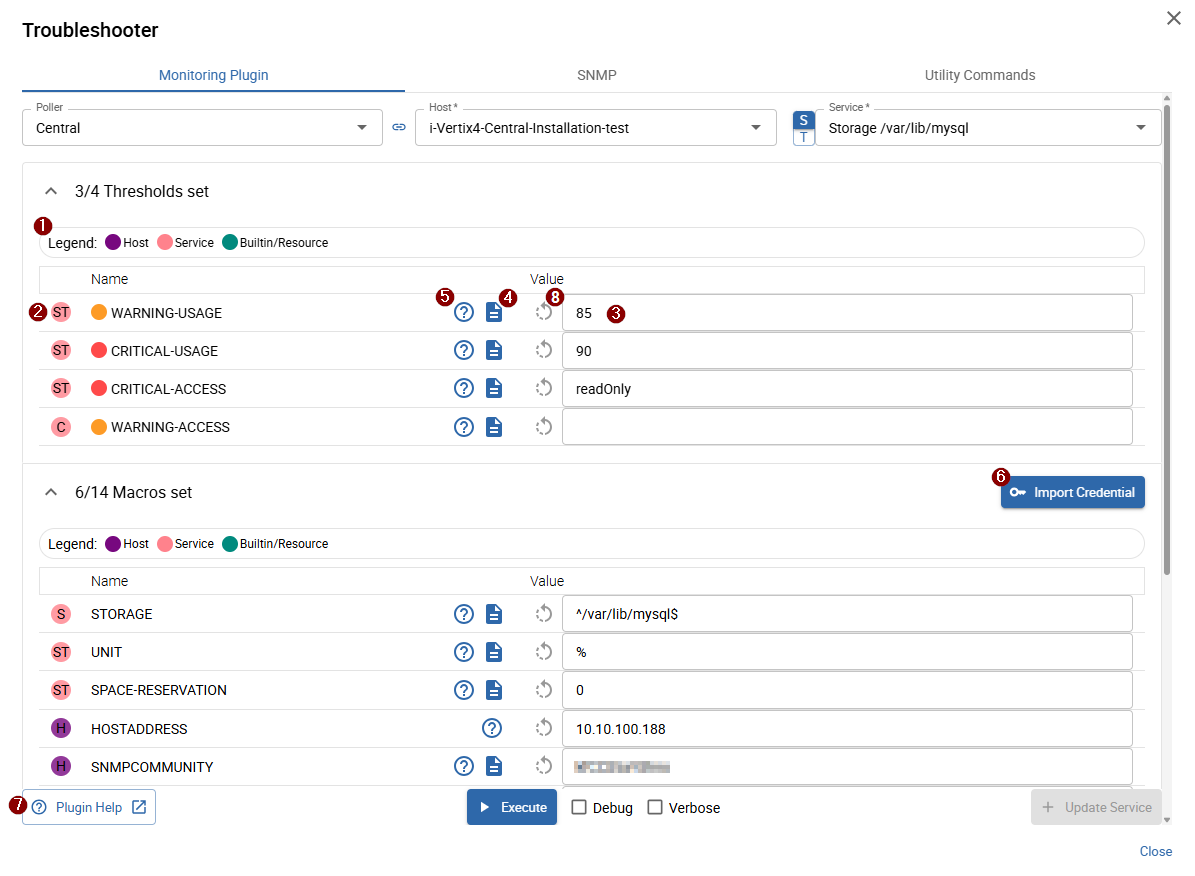
- 1 Macro type legend (2)
- 2 Macro type and source: host and service macros are defined on the command and can be set/overwritten on service & host templates and/or directly on the service and host
- 3 Macro value: the current macro value (check the 2 macro source to see where it is defined)
- 4 Macro description
- 5 Macro help: opens a small popover showing the help text for the underlying command option linked to the macro
- 6 Import credential: opens the credential list with the following credential types available: SNMP, SSH, Agent, and WSMAN
- 7 Plugin help: opens a new browser tab with the complete monitoring plugin help
- 7 Reset value (only available when macro value changed): resets the current value to the originally configured value
You can perform the following actions:
- Change and tune macro values in the 3 input field
- Use the plugin/macro help to better understand the purpose and effect of a macro
- Import credentials for faster and more consistent configuration
Execute and save
After defining or tuning the macros, you can execute your current service configuration by clicking the 1 Execute button at the bottom of the popup.
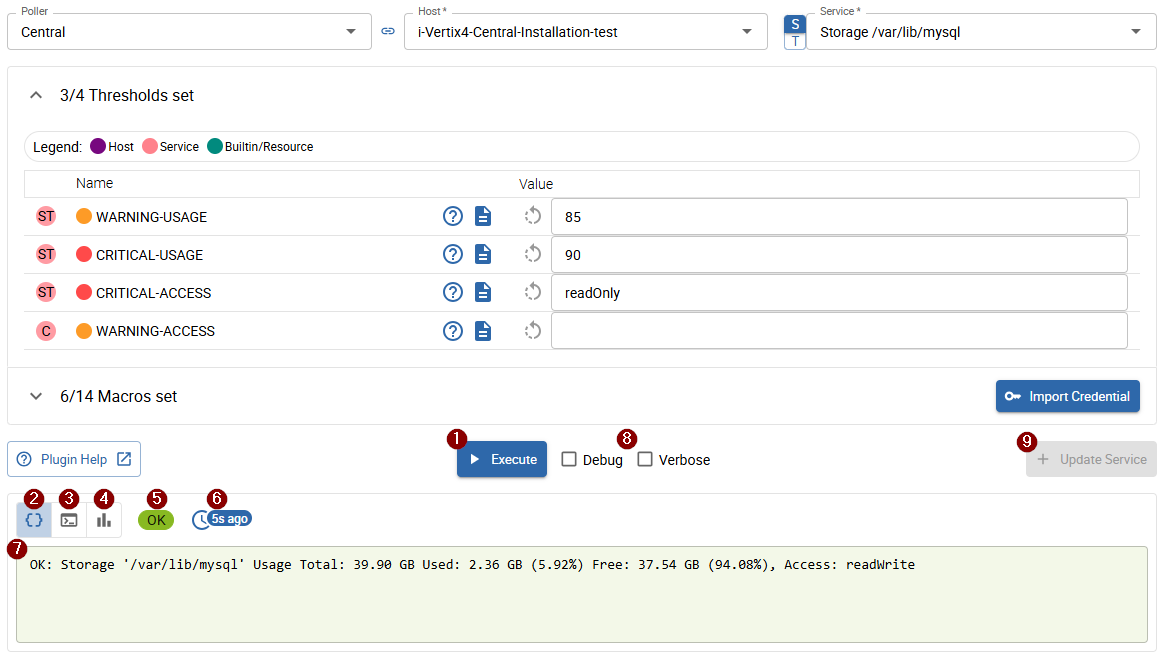
The result view appears below the Execute button and shows the following information:
- 2 Command output (default): click to switch the 7 output to the command output
- 3 Command: click to switch the 7 output to the executed command line
- 4 Performance data: click to switch the 7 output to the performance data
- 5 Status: the monitoring status returned by the command
- 6 Execution time: when the command was last executed
- 7 Output: determined by 2, 3, and 4
- 8 Debug & Verbose: select to include debug and/or extended information (displayed according to the selected output mode)
- 9 Update Service or Create Service (only visible when changes were made): updates the modified macro values on the current service, or creates a new service on the selected host when using a service template
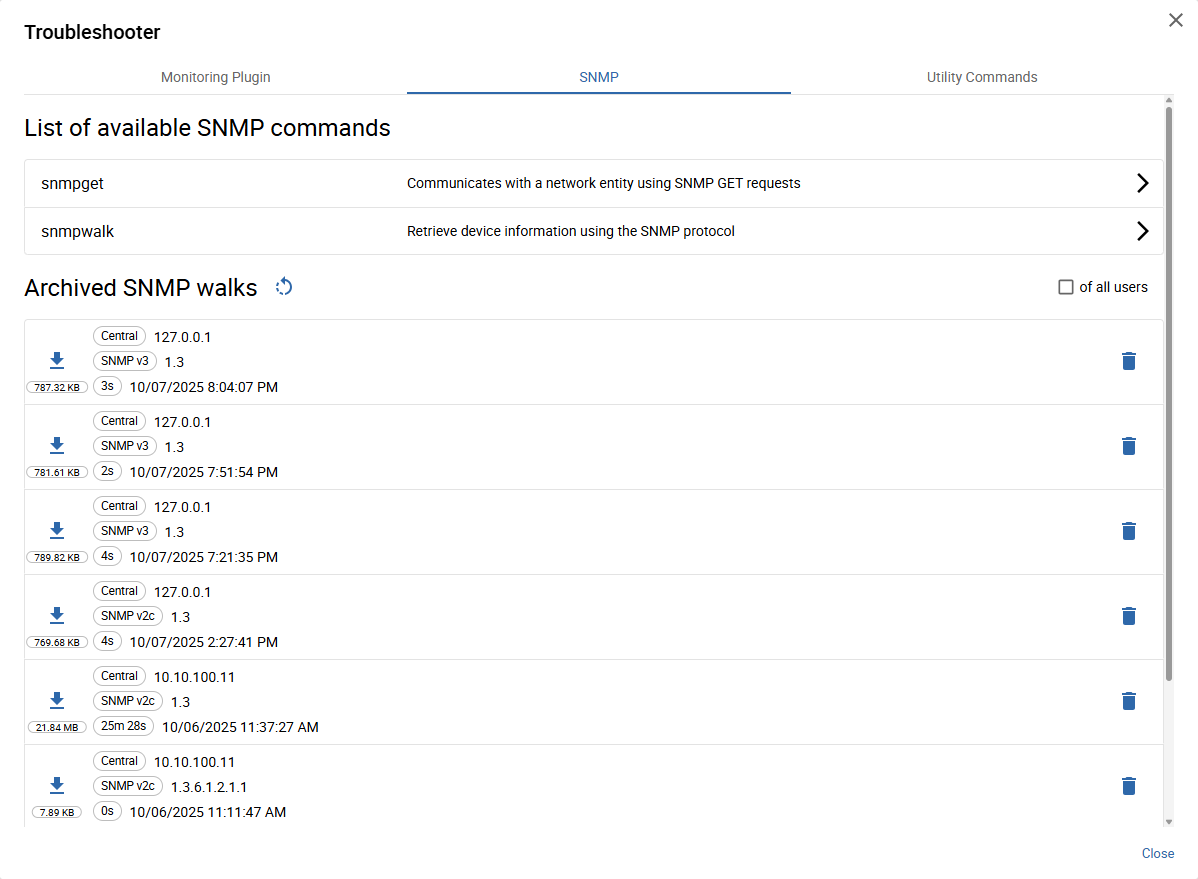
Launch SNMP commands
accessible from the SNMP tab
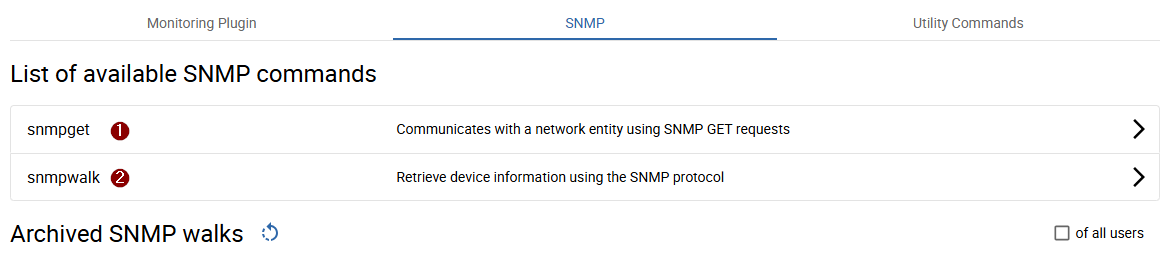
Click the 1 + button to start a new SNMP-Get request or 2 to start a new SNMP walk.
Let's start off with a new snmpwalk.
Define walk properties
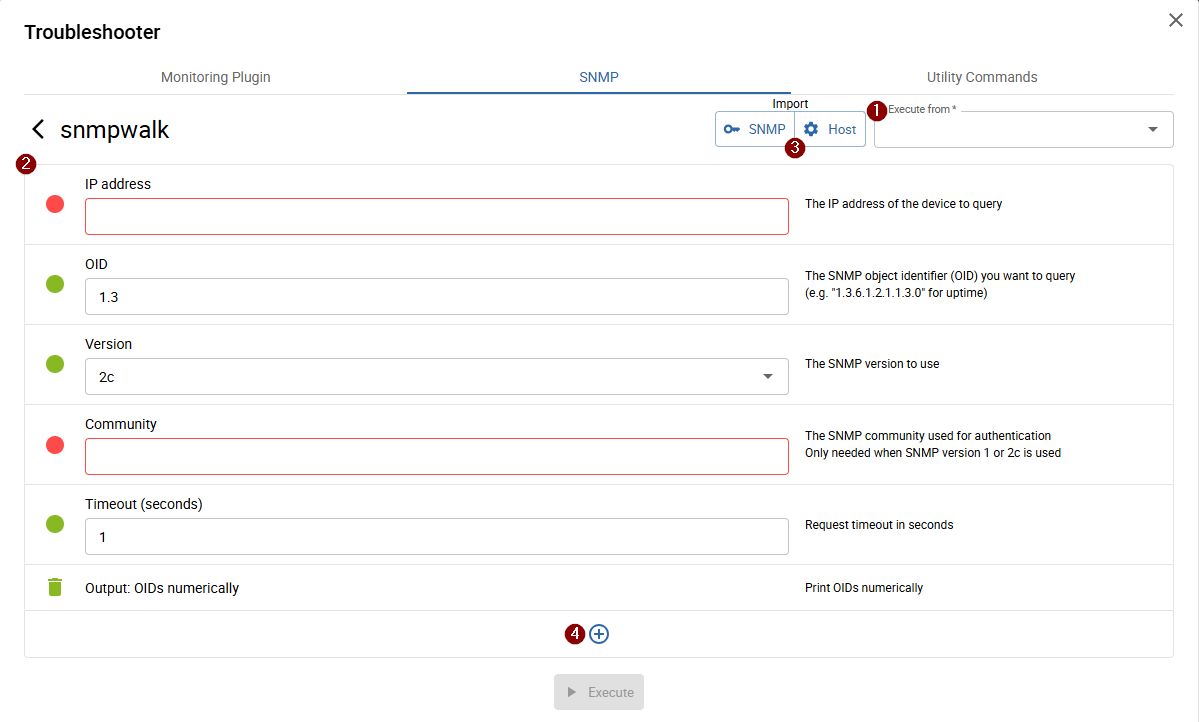
On the opened page, define the 1 poller from which the walk should be executed, the target address, the SNMP credentials, and the OID for the walk (2).
You can also 3 import values from a configured Monitoring Host or SNMP Credential:
Import from Host
Click Host under Import to open the host selector.
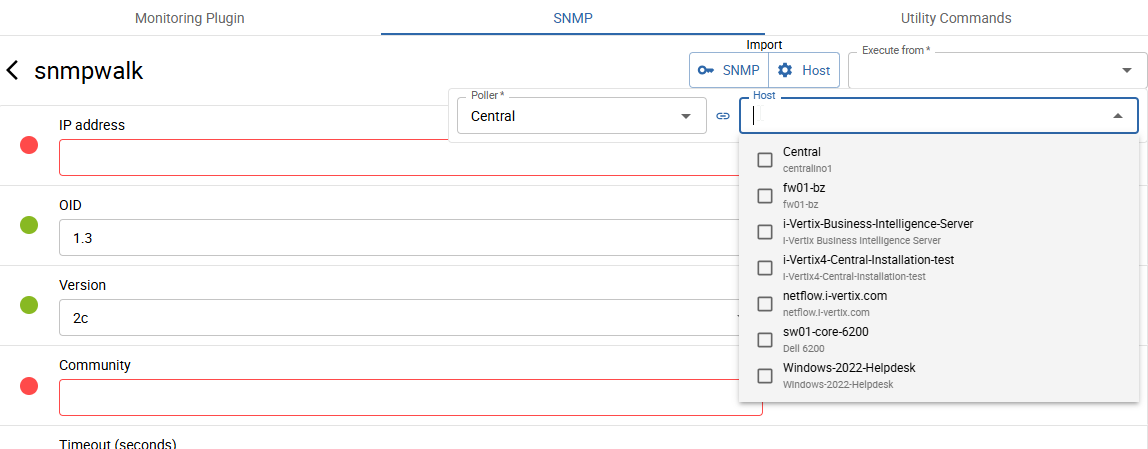
After selecting a host, all available values including Poller (Execute from), Host address, and SNMP version + community or v3 credentials are loaded.
Import from SNMP credential
Click SNMP under Import to open the credential selection popup.
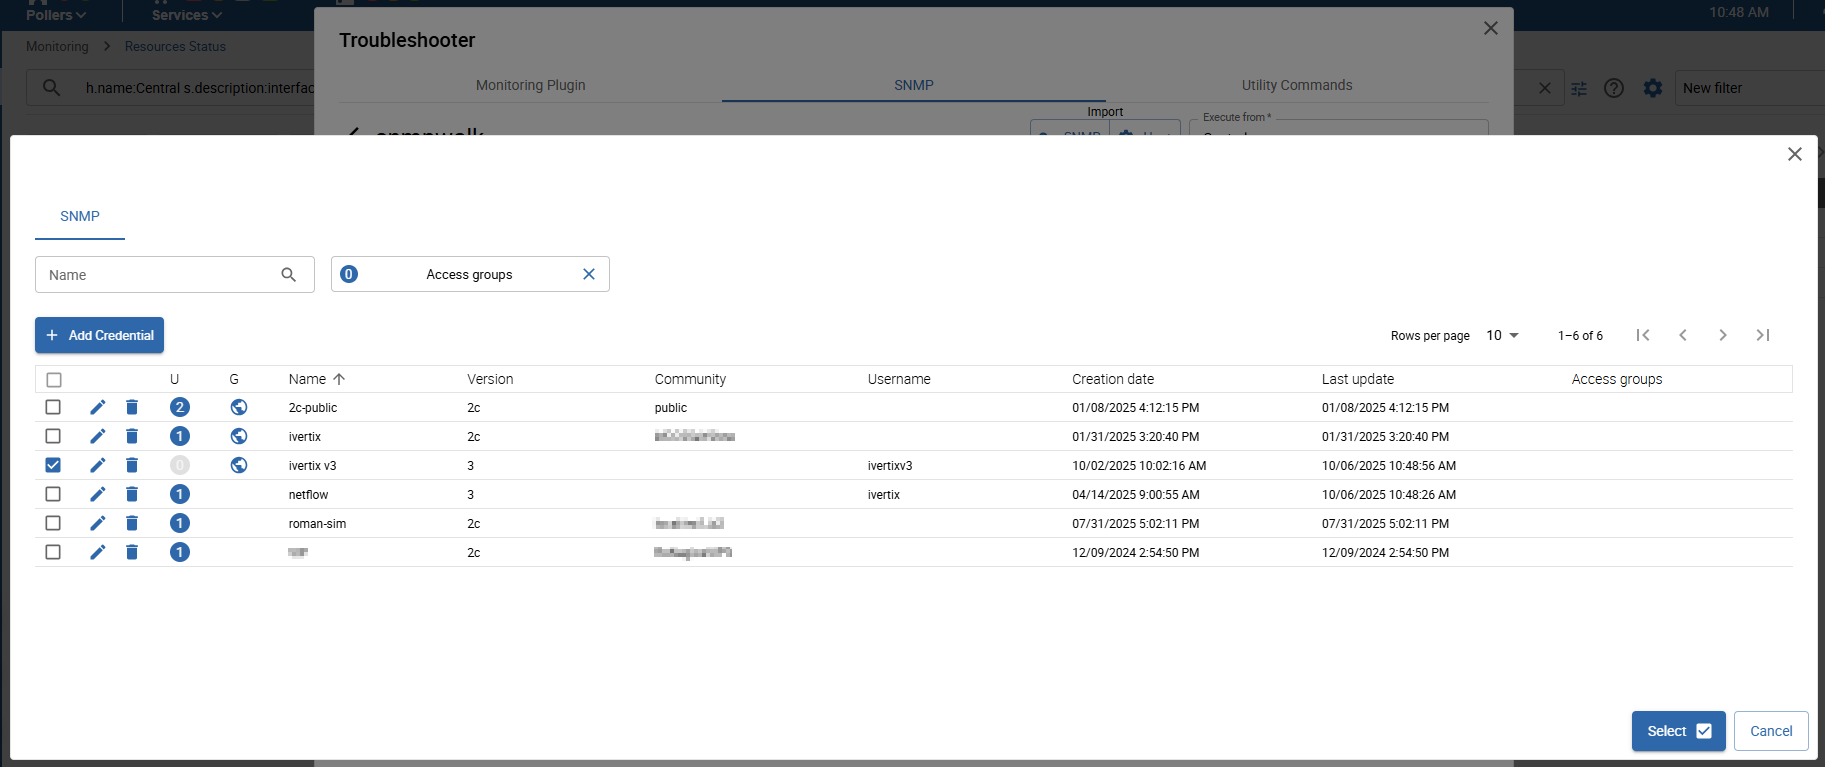
Select the credential you want to import and click Select. Shortly after, the credential values will be loaded into your walk configuration.
You still need to define the Host address and Poller (Execute from) manually.
You can combine imports from Host and SNMP Credential. The last import always overwrites previously imported values.
If you need to use different SNMP authentication than configured on the host, first import values from the Host and then import the desired SNMP Credential.
Some parameters may become invalid during configuration. When hovering over the red dot, you can see the reason why.
For example, when selecting Version "3", the Community parameter becomes obsolete. In that case, you need to delete or clear its value. The same applies for Version "2c" or "1" — in those cases, clear all version "3"-related parameters (username, authentication protocol, passphrases, etc.).
To manually add parameters, click 4 + at the bottom of the page.
Execute walk
To launch the walk, click Execute after defining the required parameters.
After a maximum of ~5 seconds, the result will be displayed below with three possible outcomes:
- Finished (< 100 lines output)
- Finished (> 100 lines output)
- Still in progress
- Failed
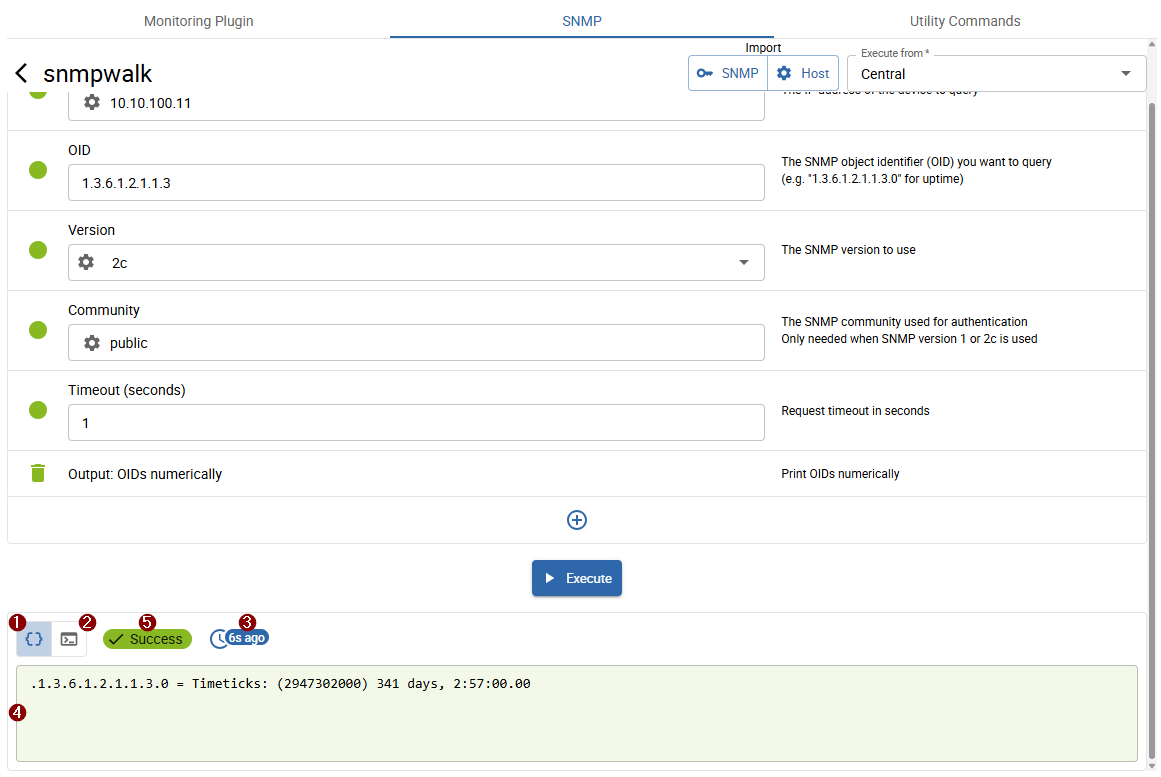
The walk finished in under 5 seconds and returned fewer than 100 lines. The result is displayed directly on the screen.
- 1 Walk output
- 2 Executed command
- 3 Execution time
- 4 Output: shows the walk output or executed command depending on 1 or 2 selection
- 5 Execution status
You can also download the walk by hovering over the output and clicking the download button:

If the walk finished quickly but returned more than 100 lines, refer to the next tab (Finished (> 100 lines output)).
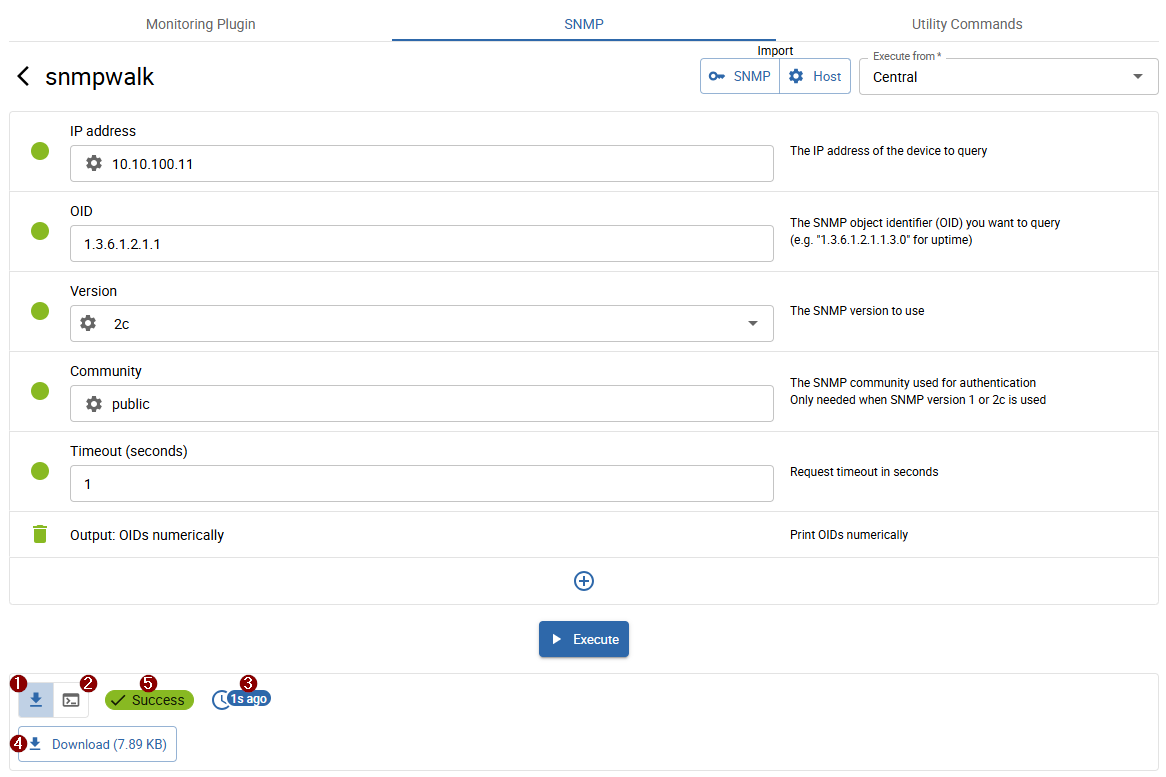
The walk finished in under 5 seconds and returned more than 100 lines. The walk is available for download.
- 1 Walk download
- 2 Executed command
- 3 Execution time
- 4 Output: shows the download button or executed command depending on 1 or 2 selection
- 5 Execution status
The walk is also archived and available in the SNMP Walk list for future downloads.
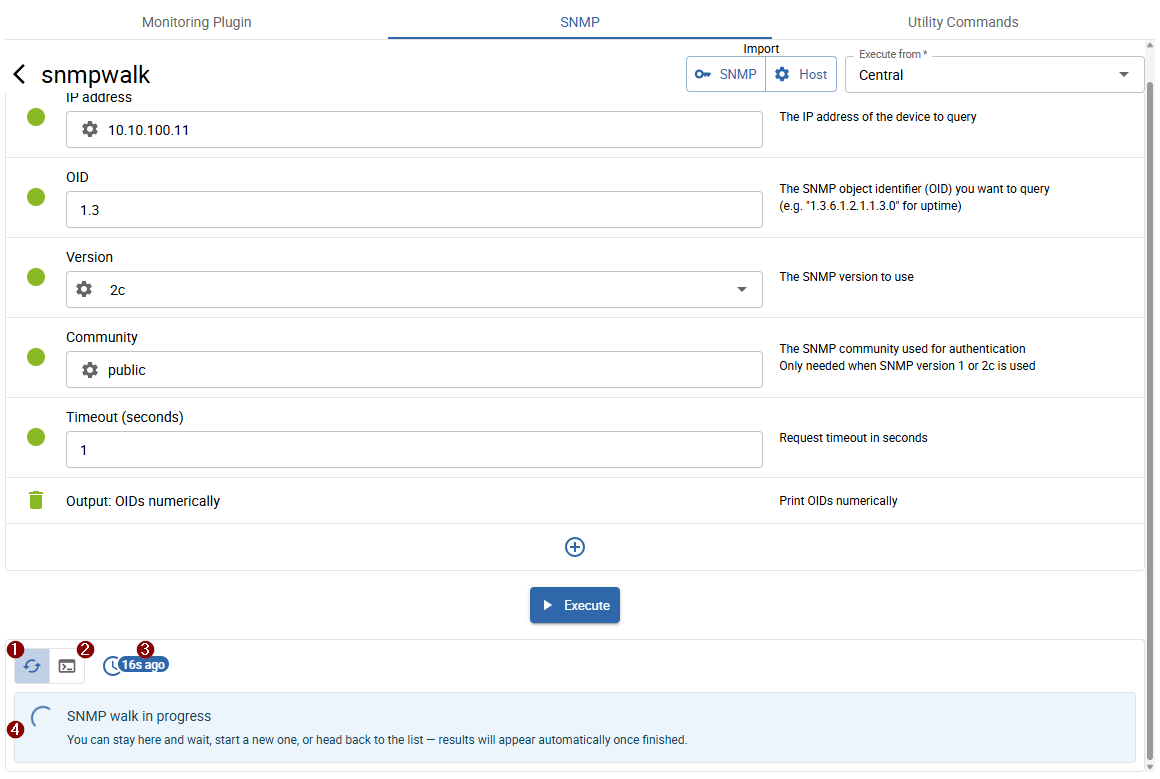
The walk did not finish within 5 seconds and is still in progress.
- 1 Walk in progress
- 2 Executed command
- 3 Execution time
- 4 Output: shows general information or the executed command depending on 1 or 2 selection
In the meantime, you can:
- wait on the current page until the walk finishes (the walk status updates automatically)
- launch another walk
- return to the walk list (
<button in the top-left near snmpwalk)
Once the walk finishes, the result will be available for download from the walk list (or directly on the same page if you waited for it).
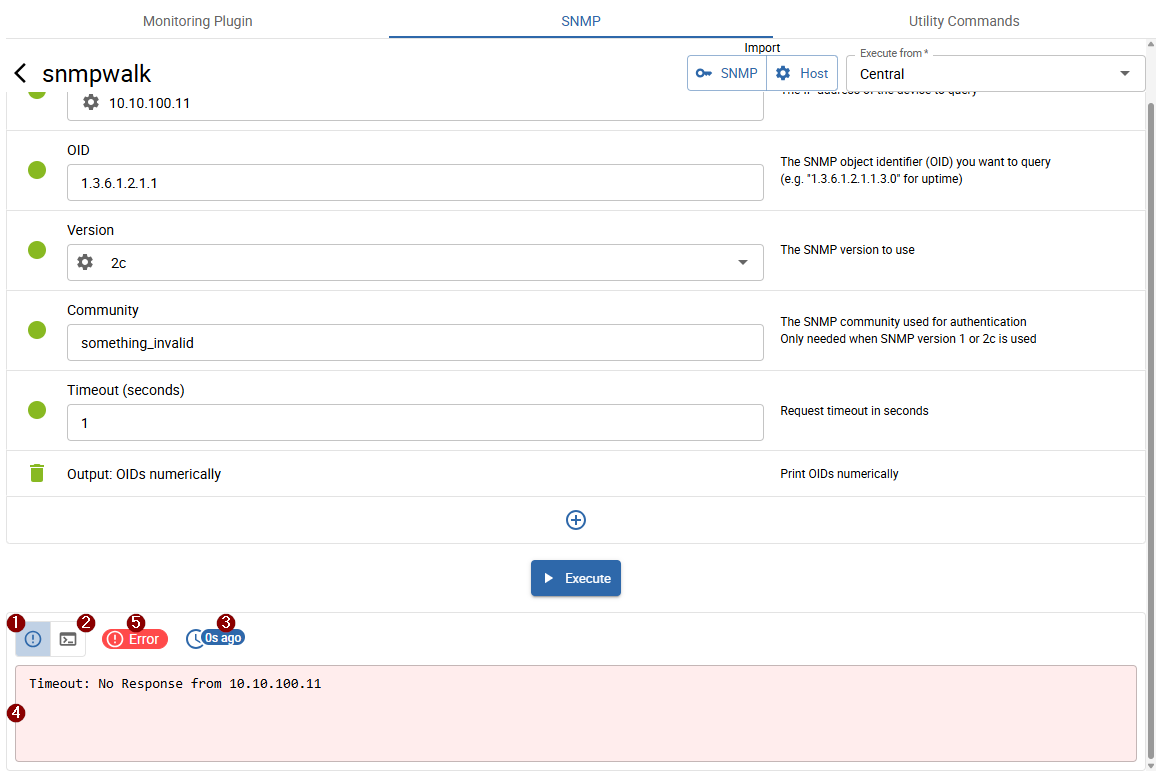
The walk failed.
- 1 Error
- 2 Executed command
- 3 Execution time
- 4 Output: shows the error or executed command depending on 1 or 2 selection
- 5 Execution status
Access archived SNMP walks
All 1 archived walks or walks in progress are accessible from the SNMP walk list
(initially displayed when opening the SNMP tab or by clicking the < button after launching a walk).
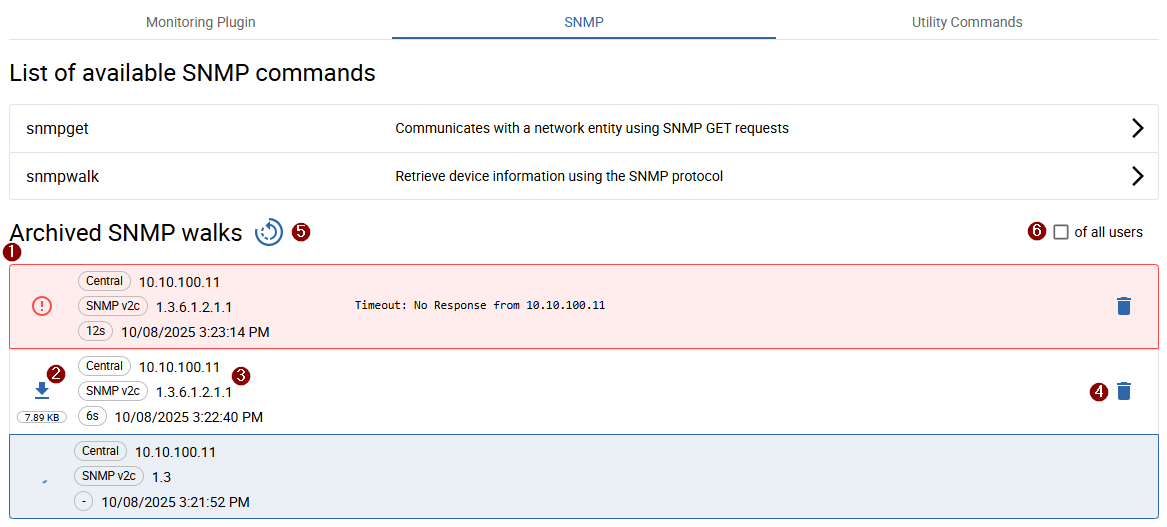
Each walk is represented with 3 details such as OID, Version, Poller, IP address, and duration.
Walks currently in progress are displayed with a loading icon and a blue background. Failed walks are displayed with a red background.
To download a completed walk, click the 2 Download button.
To delete a walk, click the 4 Delete button.
Archived walks are automatically deleted after 7 days.
Use the 6 of all users checkbox to view all archived SNMP walks of all users.
Execute SNMP-Get Request
As previously stated you can also launch a new SNMP-Get Request from the SNMP tab.
The definition and handling of the command paramters is equal to the parameters of the snmpwalk command.
The only noticeable difference between these two commands are, that snmpget requests only query one value and walks can request more values.
snmpget results also won't be archived.
Execute Utility Commands
accessible from the Utility Commands tab
Select one of the available commands you want to execute.
Define Command Parameters
On the opened page, define the 1 poller from which the command should be executed and all 2 required parameters.
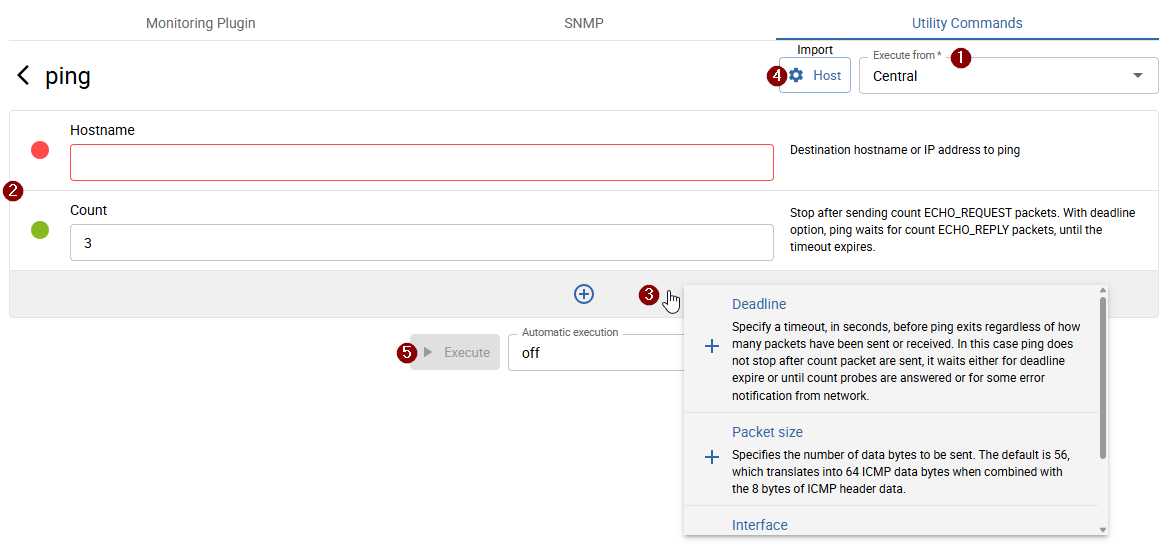
The indicator dot next to each parameter shows its validity.
Required parameters are always displayed; additional optional parameters can be added by clicking the 3 + button at the bottom of the page.
For some commands, it is also possible to 4 import values from configured hosts or SNMP credentials.
Execute Command
After defining the parameters and setting the Poller, execute the command by clicking the 5 Execute button.
It is also possible to run the command automatically every x seconds. To do so, first select the automatic execution interval, then click Execute.
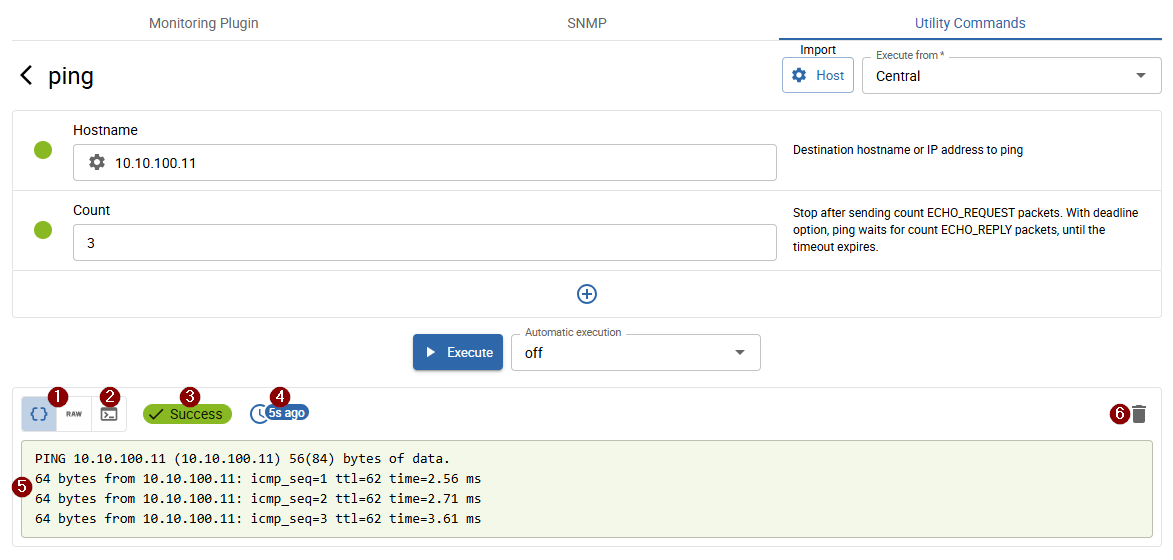
The result is displayed as follows:
- 1 Output (default selected): in some cases, the output is formatted or truncated. In such cases, an additional
Rawoutput option is available to view the original content. - 2 Executed command
- 3 Status
- 4 Execution time
- 5 Output (depending on 1 / 2 selection)
- 6 Clear output
When automatic execution is enabled, the output of each executed command is appended to the previous output.
Only certain commands, such as top, overwrite the existing output.