Debug SNMP Traps management
Debug SNMP Traps
Several elements are involved in SNMP traps management. In case of a problem, it is necessary to check the proper functioning of its architecture, there are several things to check.
Sender settings
The first thing to do is to check the configuration of the device or application that issued the trap you should have received. Check the IP address or DNS name, SNMP community, and version.
Firewall, routing
The second point is to control network firewalls and software permissions, and to implement a specific routing. If one or more network firewalls are present, or if port translation and/or IP addressing is in place, make sure that the connection between the sender and the poller is possible. Using network probes, debugging network devices (firewalls and routers), or software tcpdump/wireshark on the poller can help you confirm receipt of data on UDP port 162.
Snmptrapd
After validating the connection, check the operational status of the snmptrapd process (which must be running) and its configuration options. It is possible to enable logging of the process. To do this, edit the /etc/sysconfig/snmptrapd file and replace the "OPTIONS" line with the following:
# snmptrapd command line options
# OPTIONS="-On -d -t -n -p /var/run/snmptrapd.pid"
OPTIONS="-On -Lf /var/log/snmptrapd.log -p /var/run/snmptrapd.pid"
Restart the process to take the changes into account. Thus, any SNMP traps received will be listed in /var/log/snmptrapd.log.
If you are filtering by SNMP community, check the allowed communities in the /etc/snmp/snmptrapd.conf configuration file. If, after all these checks, SNMP traps are not included in the log, verify that the process is listening on UDP port 162 for remote devices by using the command:
netstat -ano | grep 162
You must have a result like:
udp 0 0 0.0.0.0:162 0.0.0.0:* off (0.00/0/0)
If not, change the listening port of the process.
Don't forget to disable the logs after you've finished. Otherwise, the size of the logs can be very important.
Centreontrapdforward
Once the snmptrapd process is validated, check the centreontrapdforward process. The first step is to check the access parameters of this process snmptrapd in the file /etc/snmp/snmptrapd.conf
- Check that snmptrapd service executes centreontrapdforward. To do this, edit the file /etc/snmp/snmptrapd.conf and verify that its contains:
traphandle default su -l centreon -c "/usr/share/centreon/bin/centreontrapdforward"
If the path to the file is incorrect, change it and restart the snmptrapd process. You can check that the centreontrapdforward binary is working properly by checking the configuration part of centreontrapdforward.
Centreontrapd
The next process to check is Centerontrapd. This daemon allows you to connect an SNMP trap to a passive service connected to a host in i-Vertix using an IP address or DNS from a remote device. To verify its operation, you should check the centreontrapd configuration settings.
You can check the proper functioning of binary centreontrapd by checking the configuration part of centreontrapd.
You can set up debug mode for the centreontrapd service. Edit the following file:
vi /etc/sysconfig/centreontrapd
Then modify option severity to debug:
OPTIONS="--logfile=/var/log/centreon/centreontrapd.log --severity=debug --config=/etc/centreon/conf.pm --config-extra=/etc/centreon/centreontrapd.pm"
Then restart centreontrapd:
systemctl restart centreontrapd
Centreon Gorgone
The Gorgoned daemon must be running to pass information from centerontrapd to the monitoring engine as an external command. Enable the debug mode via the Administration > Parameters > Debug menu and restart the process.
If any external commands are sent to the monitoring engine, please check the path to "$cmdFile" in the /etc/centreon/conf.pm configuration file. The path should be /var/lib/centreon/centcore.cmd in a Central i-Vertix IT Monitoring server.
Centreon Engine
The monitoring engine must receive external commands from i-Vertix Gorgone process in order to change status and output of the passive service.
Please check the event log. For Centreon Engine, the path is /var/log/centreon-engine/centengine.log.
You should find lines as:
[1352838428] EXTERNAL COMMAND: PROCESS_SERVICE_CHECK_RESULT;i-vertx-Server;Traps-SNMP;2;Critical problem
[1352838433] PASSIVE SERVICE CHECK: i-vertix-Server;Traps-SNMP;2;Critical problem
If only the external command appears but not the consideration thereof by the scheduler ("PASSIVE SERVICE CHECK"), there may be a system clock problem synchronizing issue. The server is late and the order will be processed later, either in advance and the order will not be taken into account.
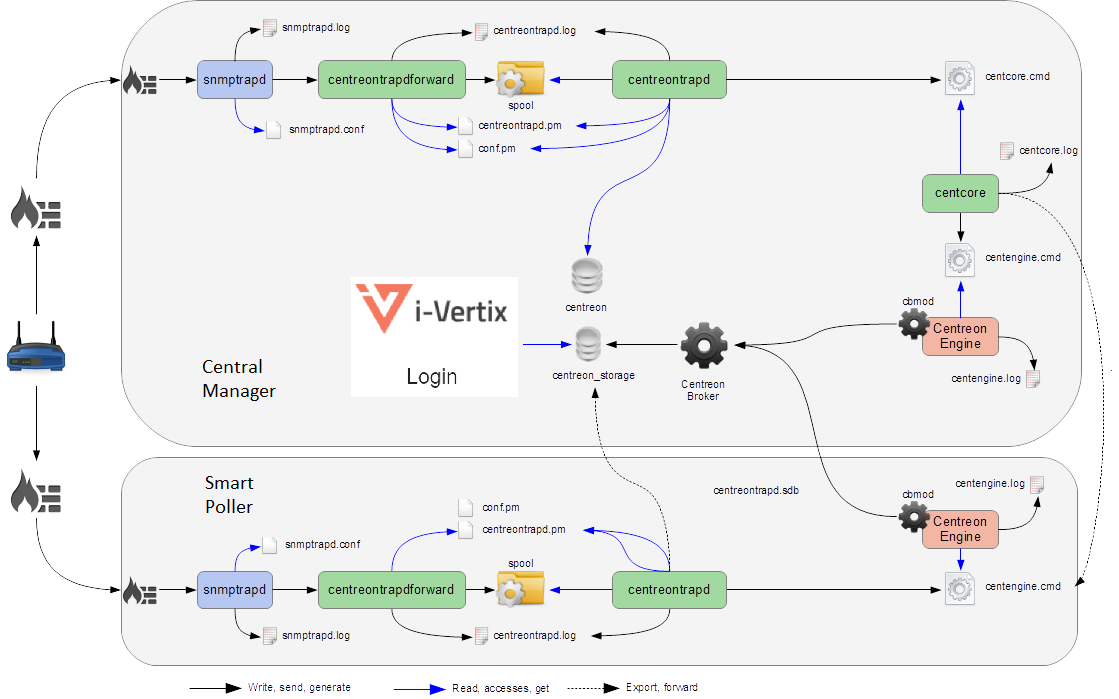
Detailed diagram
You will find below a detailed diagram of all the processes used and/or present at the reception of an SNMP trap: